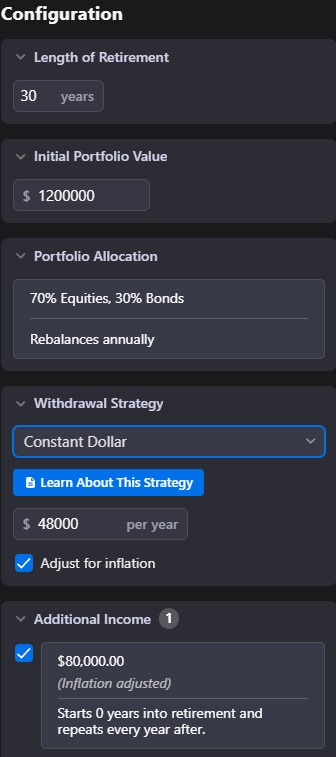
Let's set up a simple scenario in FiCalc: A retired couple has $1.2M and gets $80K a year in social security or other income (inflation adjusted) forever:
Portfolio $1.2M
AA: 70% stock, 30% bond (doesn't really matter)
Additional Income: $80,000 every year start on year 0, and repeats forever
![Image]()
Starting with the case that works as I expect it, if you select constant Dollar withdrawal and set it to $48,000 a year (4% of $1.2M), you get 100% success since it's 4%, but also the "available spend" chart shows it's a constant 48K
This means that the "spend" chart is really a withdrawal chart. You can withdraw $48K, and with the $80K income, it really should say $128k
when overing over the spend chart, it does say "initial withdrawal" not "initial spend" for example.
OK so "spend" is withdrawal, add your yearly income to it for the total. got it!
Now let's pick one of the variable withdrawal, like VPW. I also cleared the minimal withdrawal checkbox although I don't think it matters.
You get a 100% success, of course it's VPW, it can't run out of money.
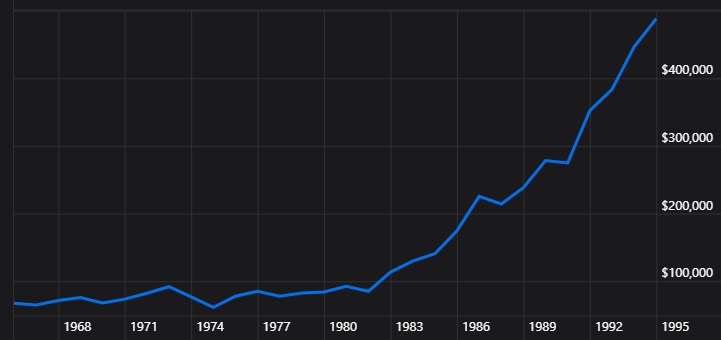
The available spend is interesting, it has a minimum of $45K and max of $800K. Let's drill into 1966:
The first year withdrawal is $67,250, it varies around that with the minimum of $61K in 1974, then takes off in the 80s and 90s, with 1982 at a comfy $85K
![Image]()
So it means my first year withdrawal is about $80k+$67K = $147K? and that in 1982 I'll have $80K+$85K = $165K? sign me up!
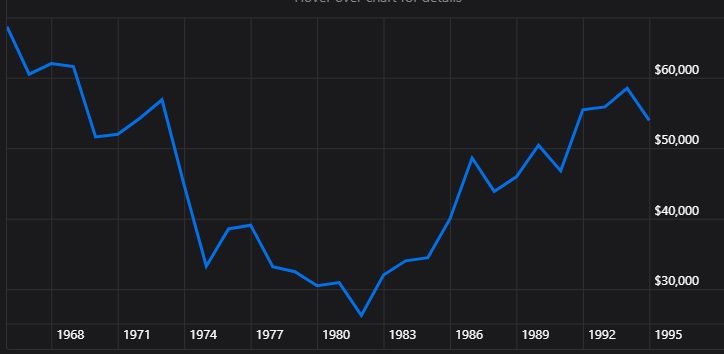
Except that I've looked at enough 1966 stock market returns that something doesn't look right. Let's run an experiment and remove the income floor. I would expect the first year to show $67.25K and year 1982 to show $85K right? Wrong!:
![Image]()
wow, that chart looks different: first year is $67.25K just as expected, but 1974 income is $33K and the absolute low in 1982 at $26K.
Adding an $80K income in 1982, we would have $106K to spend, instead of $165K
So obviously FiCalc doesn't look at the additional income as a "floor" that you complement with the portfolio. I'm guessing it adds it to the portfolio itself, then applies VPW percentage rules. One could even argue that it's a proper way to do VPW (although not what longinvest describes and not how I intend to run it). But it's even more ridiculous with the constant dollar 4% rule: it literally modeled "add your SS to your portfolio rather than spend it, but continue pulling the constant dollar and let your portfolio grow even more"
Am I confused? Is there a way to model a floor rather than portfolio ads? the only thing I can thing of is leaving it out of the calculations completely, and manually/mentally add it to every result and graph. so my income in 1982 would have been $106K.
Portfolio $1.2M
AA: 70% stock, 30% bond (doesn't really matter)
Additional Income: $80,000 every year start on year 0, and repeats forever
Starting with the case that works as I expect it, if you select constant Dollar withdrawal and set it to $48,000 a year (4% of $1.2M), you get 100% success since it's 4%, but also the "available spend" chart shows it's a constant 48K
This means that the "spend" chart is really a withdrawal chart. You can withdraw $48K, and with the $80K income, it really should say $128k
when overing over the spend chart, it does say "initial withdrawal" not "initial spend" for example.
OK so "spend" is withdrawal, add your yearly income to it for the total. got it!
Now let's pick one of the variable withdrawal, like VPW. I also cleared the minimal withdrawal checkbox although I don't think it matters.
You get a 100% success, of course it's VPW, it can't run out of money.
The available spend is interesting, it has a minimum of $45K and max of $800K. Let's drill into 1966:
The first year withdrawal is $67,250, it varies around that with the minimum of $61K in 1974, then takes off in the 80s and 90s, with 1982 at a comfy $85K
So it means my first year withdrawal is about $80k+$67K = $147K? and that in 1982 I'll have $80K+$85K = $165K? sign me up!
Except that I've looked at enough 1966 stock market returns that something doesn't look right. Let's run an experiment and remove the income floor. I would expect the first year to show $67.25K and year 1982 to show $85K right? Wrong!:
wow, that chart looks different: first year is $67.25K just as expected, but 1974 income is $33K and the absolute low in 1982 at $26K.
Adding an $80K income in 1982, we would have $106K to spend, instead of $165K
So obviously FiCalc doesn't look at the additional income as a "floor" that you complement with the portfolio. I'm guessing it adds it to the portfolio itself, then applies VPW percentage rules. One could even argue that it's a proper way to do VPW (although not what longinvest describes and not how I intend to run it). But it's even more ridiculous with the constant dollar 4% rule: it literally modeled "add your SS to your portfolio rather than spend it, but continue pulling the constant dollar and let your portfolio grow even more"
Am I confused? Is there a way to model a floor rather than portfolio ads? the only thing I can thing of is leaving it out of the calculations completely, and manually/mentally add it to every result and graph. so my income in 1982 would have been $106K.
Statistics: Posted by Raspberry-503 — Sat Oct 26, 2024 1:22 am — Replies 0 — Views 26